NSG Portal Education: Multiple Sclerosis and NEURON
Understanding Multiple Sclerosis Through Simulation
The Study
Part 1: A code was generated to model a single uniformly myelinated axon. Based on known facts about the propagation of action potentials, the following graph was predicted in which a decaying current travels to a node and is regenerated, as shown by the spike (Figure 1).
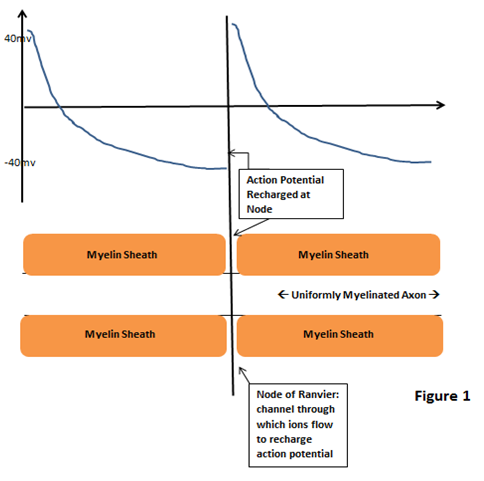
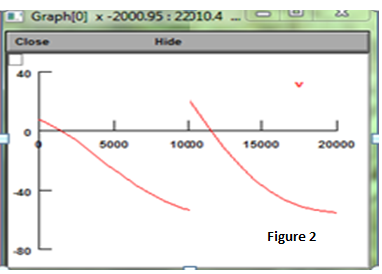
The code was loaded into the NEURON Simulator and a graph similar to that in Figure 1 was generated.
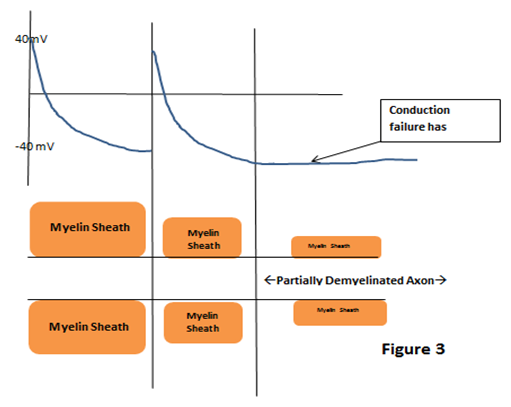
Part 2: The original code was modified to demonstrate demyelination, resulting in conduction failure.
The following graph (Figure 3) represents the failure of action potential propagation which was predicted from known biological facts about signal conduction failure.
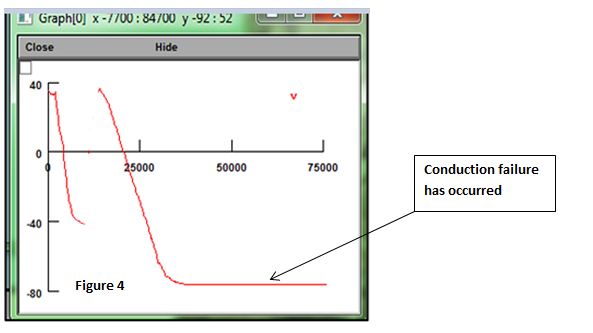
The NEURON simulation produced a graph (Figure 4) similar to the graph in Figure 3. As the action potential reached the node, it was recharged and continued to move along the length of the axon. When partial demyelination occurred (see next section to find out how to model partial demyelination) the action potential failed to regenerate itself causing a neurological disorder such as Multiple Sclerosis.
Test It on NEURON
In the second part of the study, it was stated that the original code was modified. Now we will discuss how to modify the code to demonstrate demyelination. Signal propagation through axons can be explained using simple RC Circuits. An RC circuit consists of a resistor (circled in blue in fig.5) and a capacitor (circled in green in fig.5). When the switch circuit closes, current starts to flow. Charge begins to build up in the capacitor, and when the capacitor is fully charged current ceases to flow. Axons can be modeled in the same way. In a vertebrate axon, myelin decreases the membrane capacitance, allowing signals (analogous to current in the circuit) to flow down the axon. As the myelin degenerates, the membrane capacitance starts to rise and no longer allows signals to pass through. This theory can be tested on NEURON. Using the neuron model (hoc code) provided, it can be observed that simply changing the capacitance of the demyelinated section can demonstrate the expected results.
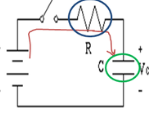
The red arrow indicates the direction of charge flow. As the charge flows, it begins to build up inside the capacitor (i.e. charging a capacitor). However, once the capacitor is fully charged, current ceases to flow.
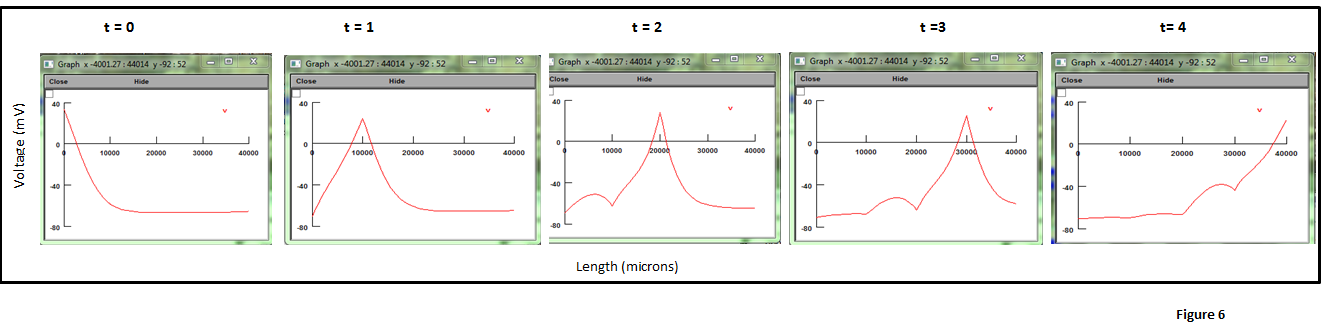
It can be observed that when an axon is perfectly myelinated (i.e. almost zero membrane capacitance so in the hoc code cm= 0.005 in the myelinated and delmyelinated portions), the action potential moves along the entire length of the axon, transmitting the signal.The following figure demonstrates five time points along the length of the axon. The units on the x-axis are in microns (the length of the axon) and the units on the y-axis are in mV. The images show the action potential moving along the length of the axon.
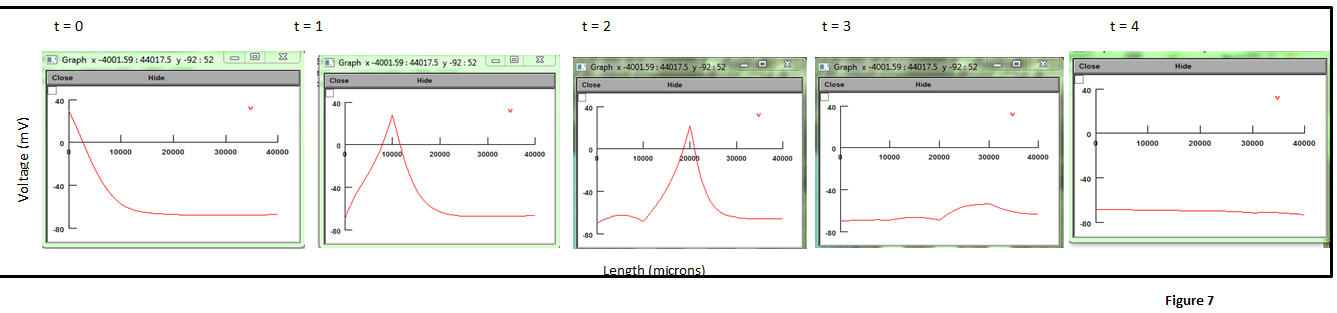
As the demyelination begins to occur at t= 3, the membrane capacitance begins to increase and the signal cannot travel through the whole axon. (In the hoc code the capacitance of the demyelinated portion ["demyel"] portion has been changed to cm=0.01 uF to obtain the following graphs, Figure 7). The last graph shows that the signal does not make it though to the end of the axon, demonstrating conduction failure at 30000 microns. The following figure demonstrates four time points along the length of the axon.
As the demyelination continues, the membrane capacitance begins to increase and the signal cannot travel through the whole axon. (In the hoc code the capacitance of the demyelinated portion ["demyel"] portion has been changed to cm=0.015 uF to obtain the following graphs, Figure 7). The graph at t = 4 shows that the signal does not make it though to the end of the axon, demonstrating conduction failure at 30000 microns. The following figure demonstrates four time points along the length of the axon.
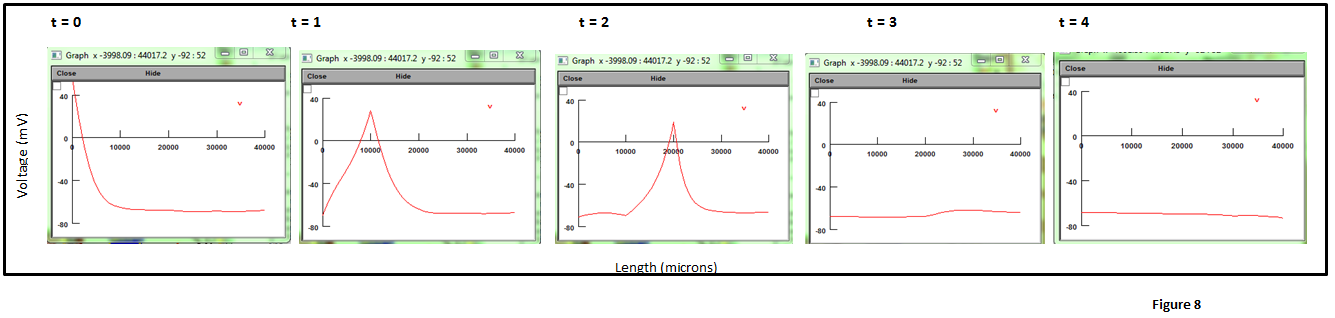
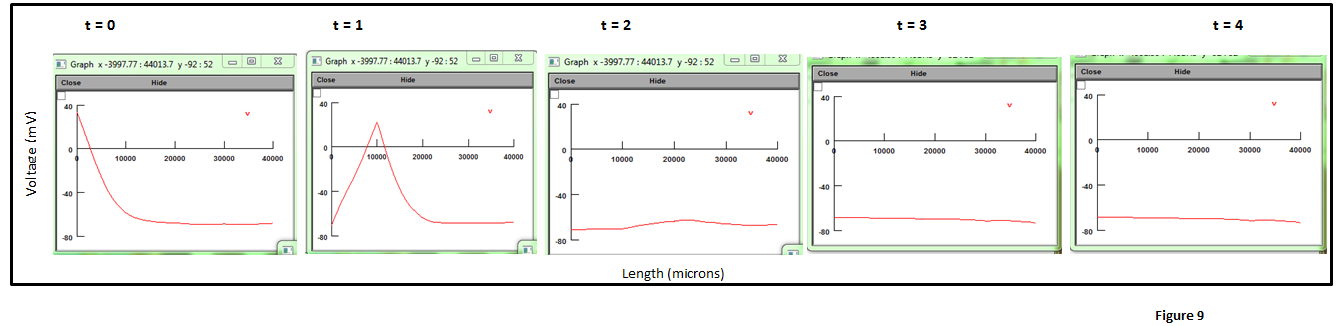
As demeylination continues to increase in the second half of the axon, capacitace further increases. The graph at t = 2 indicates that amount of myelin degenerated in too high for an action potential to propgate. Thus there is conduction failure about half-way though the length of the axon. (In the hoc code the capacitance of the demyelinated portion ["demyel"] has been changed to cm=0.02 uF to obtain the following graphs, Figure 8). The following figure demonstrates three time points along the length of the axon.
View the Simulation Live
You can watch a live simulation of the process described above.
Be sure to follow the README instructions carefully in order to view both the uniformly myelinated and the partially demyelinated models.