NSG Portal Usage Metrics
The metrics of success for the NSG is based on the following quantifiable data and these are collected via user survey, user forums, and allocation usage analysis.
- Number of publications that credit NSG and number of workshops, tutorials and classes that use NSG
- Total number of users using the NSG
- Number of user jobs recorded per quarter
- Total amount of computer time consumed on HPC resources per quarter by NSG users
NSG has been in production since Dec 2012. Various usage and users related statistics starting January 2013 are shown below.
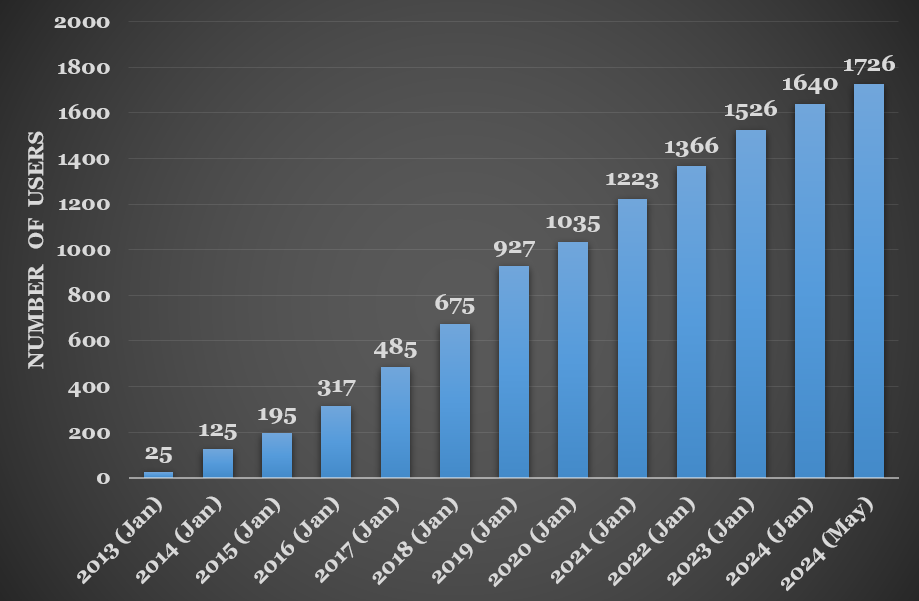
Growth in number of NSG users.
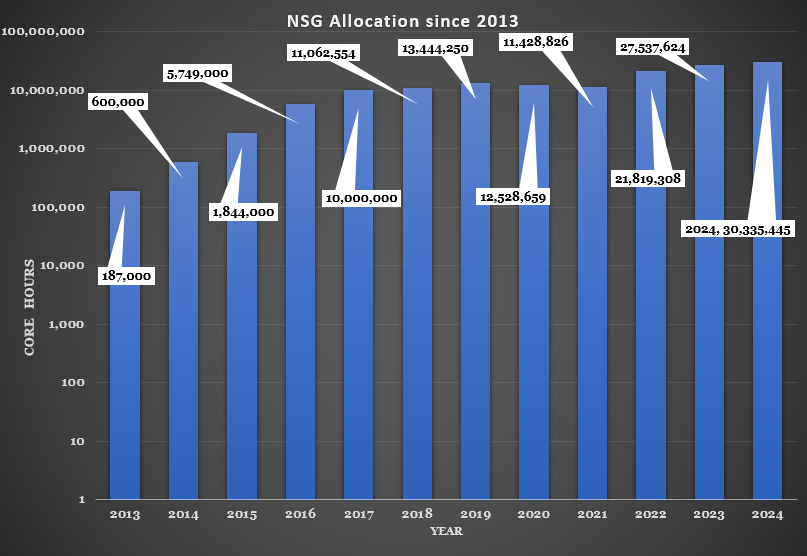
Yearly allocations acquired by NSG.
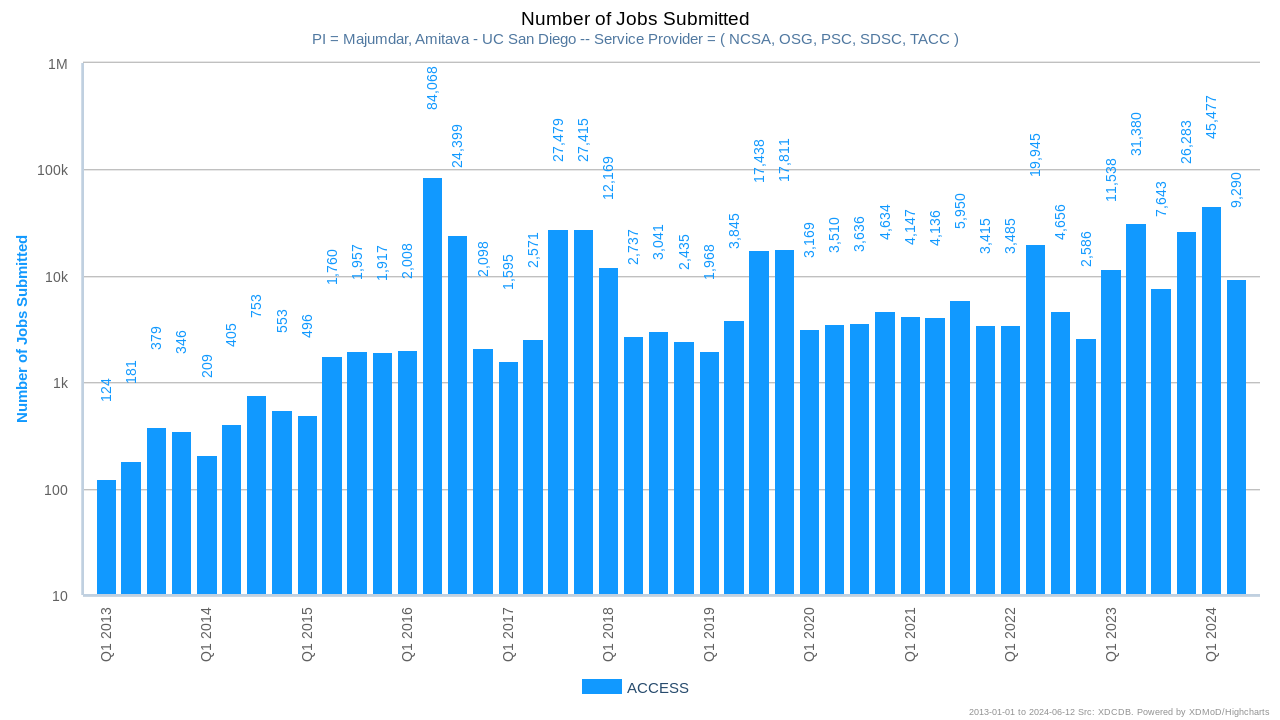
Number of jobs submitted on NSG quarterly: January 2013 - May 2024 (from XDMoD).
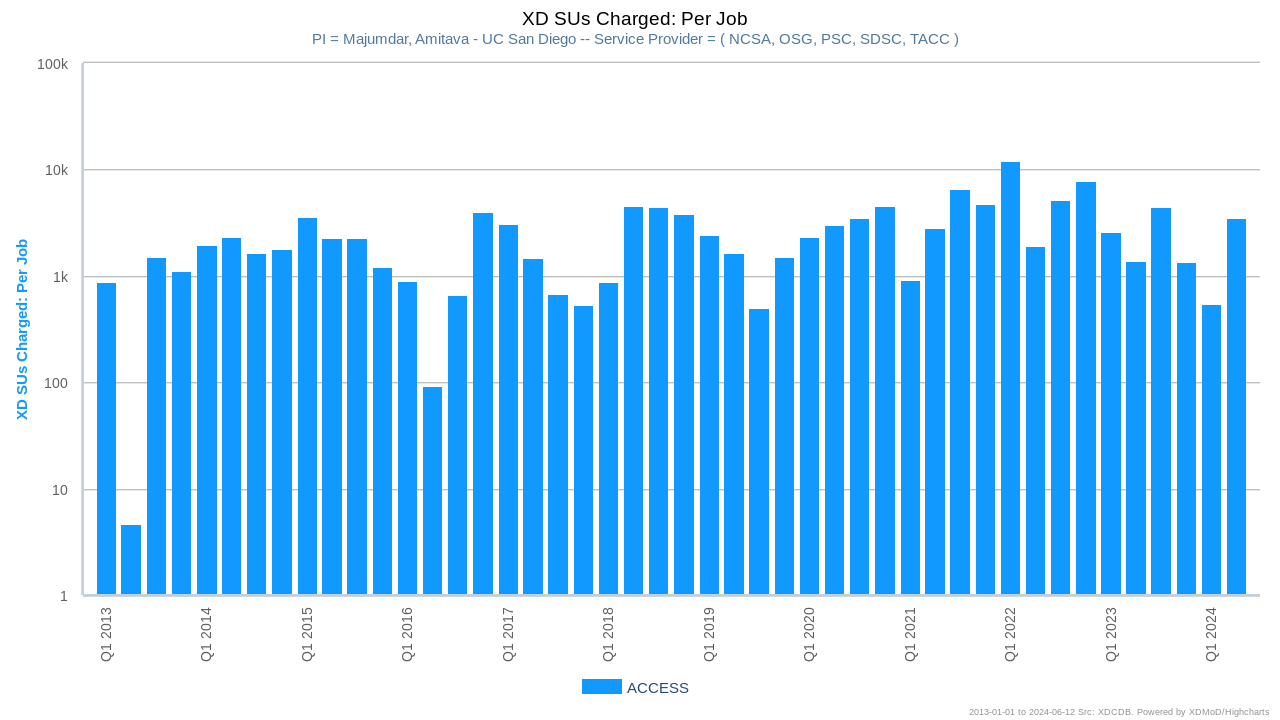
SUs charged on NSG quarterly: January 2013 - May 2024 (from XDMoD).
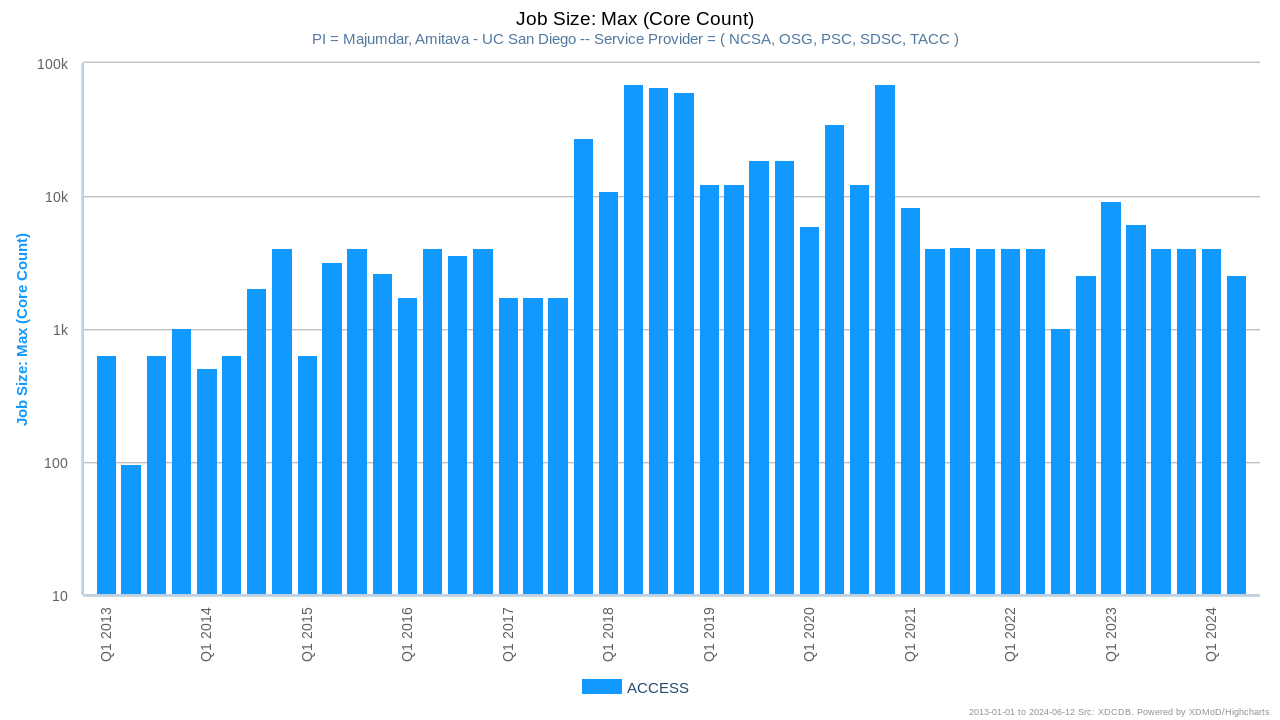
Maximum core count jobs quarterly on NSG: January 2013 - May 2024 (from XDMoD).
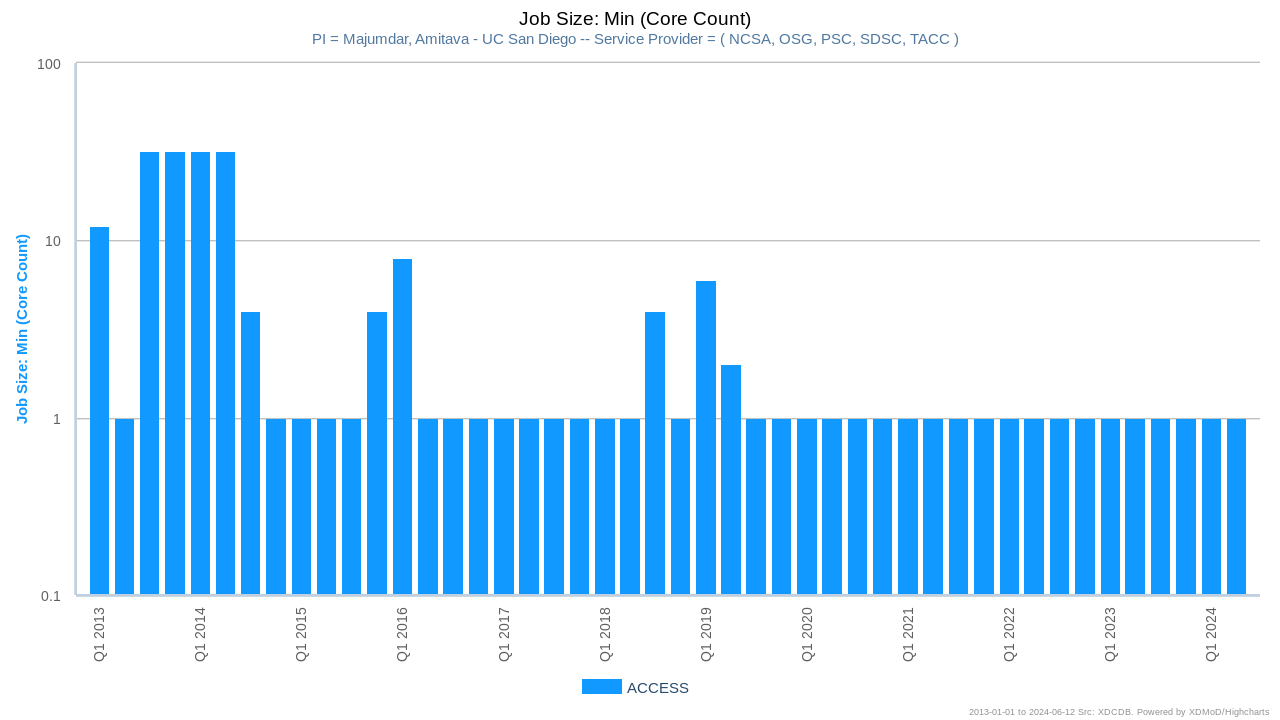
Minimum core count jobs quarterly on NSG: January 2013 - May 2024 (from XDMoD).